κ-type BEDT-TTF salt
κ-type BEDT-TTF cation radical salt is a 2D Mott-insulator. The greek alphabet κ represents a type of molecular arrangement, and the molecular structure of BEDT-TTF is shown in Figure 1A. In order to form a cation radical salt, a neutral BEDT-TTF is oxidized up to +0.5 valence and forms an ionic crystal with counter anions. The crystal structure for one of such salt is shown in Figure 1B and 1C. This κ-(BEDT-TTF)2Cu[N(CN)2]Br is the most frequently used material in our experiments. The BEDT-TTF forms 2D conduction layer with dimer structure, whose positive charge is compensated by the negative charge provided by polymeric anion Cu[N(CN)2]Br. Because the intra-dimer interaction is the strongest among all the inter-molecular interactions, the HOMO band is split into bonding and anti-bonding sub-bands. The Fermi level is located in the middle of the anti-bonding band to fill the sub-band exactly half (Effectively half-filled). As a result, the section of Fermi surface becomes a pseudo circle whose area corresponds to 100% of first Brillouin zone (Figure 1D). This round Fermi surface is overlapping with neighboring ones to form quasi-1D and lens-like-2D Fermi surfaces after the degeneracy is lifted at the crossing points.
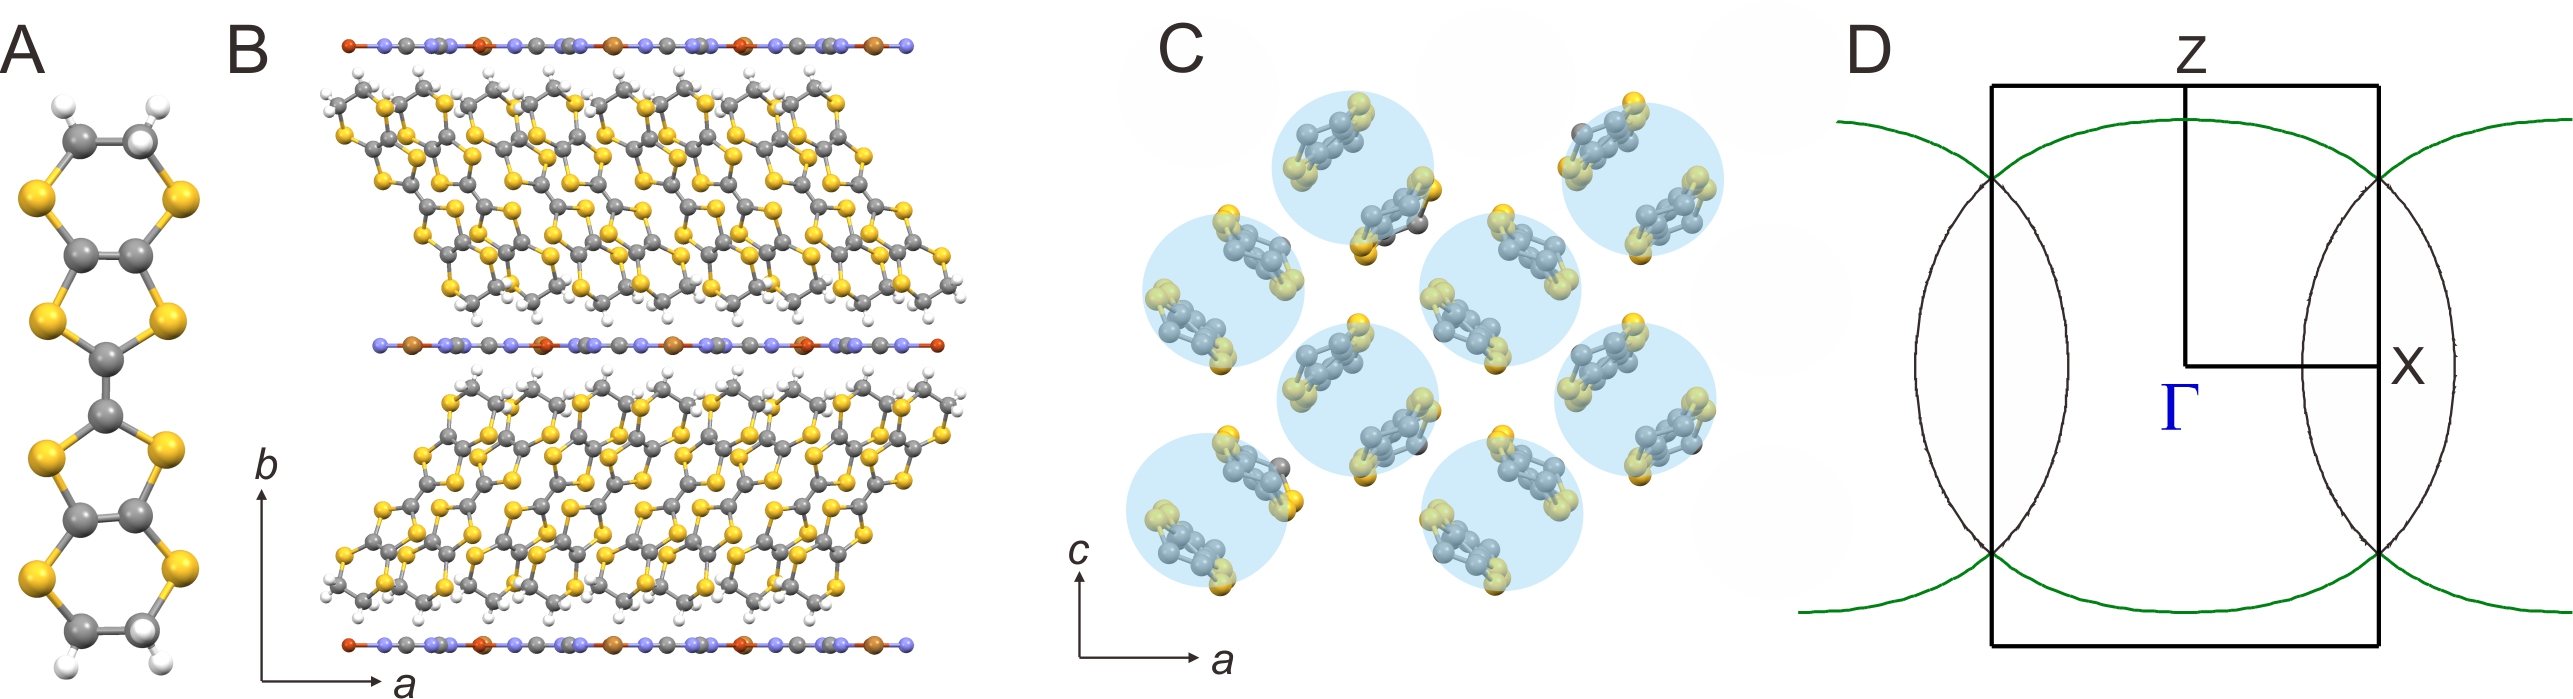
Figure1 A:Molecular structure of BEDT-TTF (Bis(ethylenedithio)tetrathiafulvalene). Yello, gray, and white balls represent sulfur, carbon, and hydrogen atoms. B:Crystal structure for κ-(BEDT-TTF)2Cu[N(CN)2]Br viewed along the c-axis direction. C:The conduction layer in κ-(BEDT-TTF)2Cu[N(CN)2]Br. The blue circles represent BEDT-TTF dimers. D:Fermi surface for κ-(BEDT-TTF)2Cu[N(CN)2]Br calculated by tight-binding approximation.
The temperature-pressure phase diagram with a fixed band filling (1/2-filling) for κ-type BEDT-TTF salt is shown in Figure 2A. The on-site Coulomb interaction (U) in the dimer is strong enough to form an Mott-insulating state when the pressure is small. On the other hand, the Mott-insulator turns into superconducting or metallic phases when the pressure is increased. In this case, the pressure is controlling the band width (W) to tune the effective electron-correlation (U/W). Chemical pressure is also able to alter the effective U/W by replacing the counter anion (with anions such as I3 or Cu(NCS)2 ) or hydrogen atoms of BEDT-TTF (with deuterium). The boundary between the Mott-insulator and superconductor is known to be a first-order transition and its critical end point is located around 40 K. In the vicinity of this first-order transition line, superconducting and Mott-insulating phases coexist and their volumes are quite sensitive to the external parameters such as pressure, temperature and magnetic field.
Let's think about a situation where the band filling is slightly different from 1/2. In such a case, the electron correlation is still remaining while the commensulability for a Mott-insulator is broken. This is the situation where the superconductivity of high-Tc cuprates is observed, and should be also interesting for organic Mott-insulators. We have been trying to realize such a 'slightly-doped organic Mott-insulator' in κ-type BEDT-TTF salt by using filed-effect-transistor (FET) because the gate electric field in FET can tune the band filling of the channel material at the interface. Fig. 2B shows the control parameters around the organic Mott-insulator, where the field effect can tune tune the band filling while a strain effect can tune the electron correlation (U/W). Organic Mott-insulators possess several advantages in studying this U/W-filling phase diagram because the crystal lattice is soft enough to induce bandwidth-controlled superconductivity and because the 2D carrier density (2×1014 cm-1) is small enough to induce bandfilling-controlled superconductivity. In theoretical point of view, it is expected that the superconducting phase is surrounding the Mott-insulator in three-dimensional phase space (Fig. 2C). This 3D phase diagram is our work hypothesis in understanding the behaviors of strongly correlated electrons observed in organic Mott-FETs.
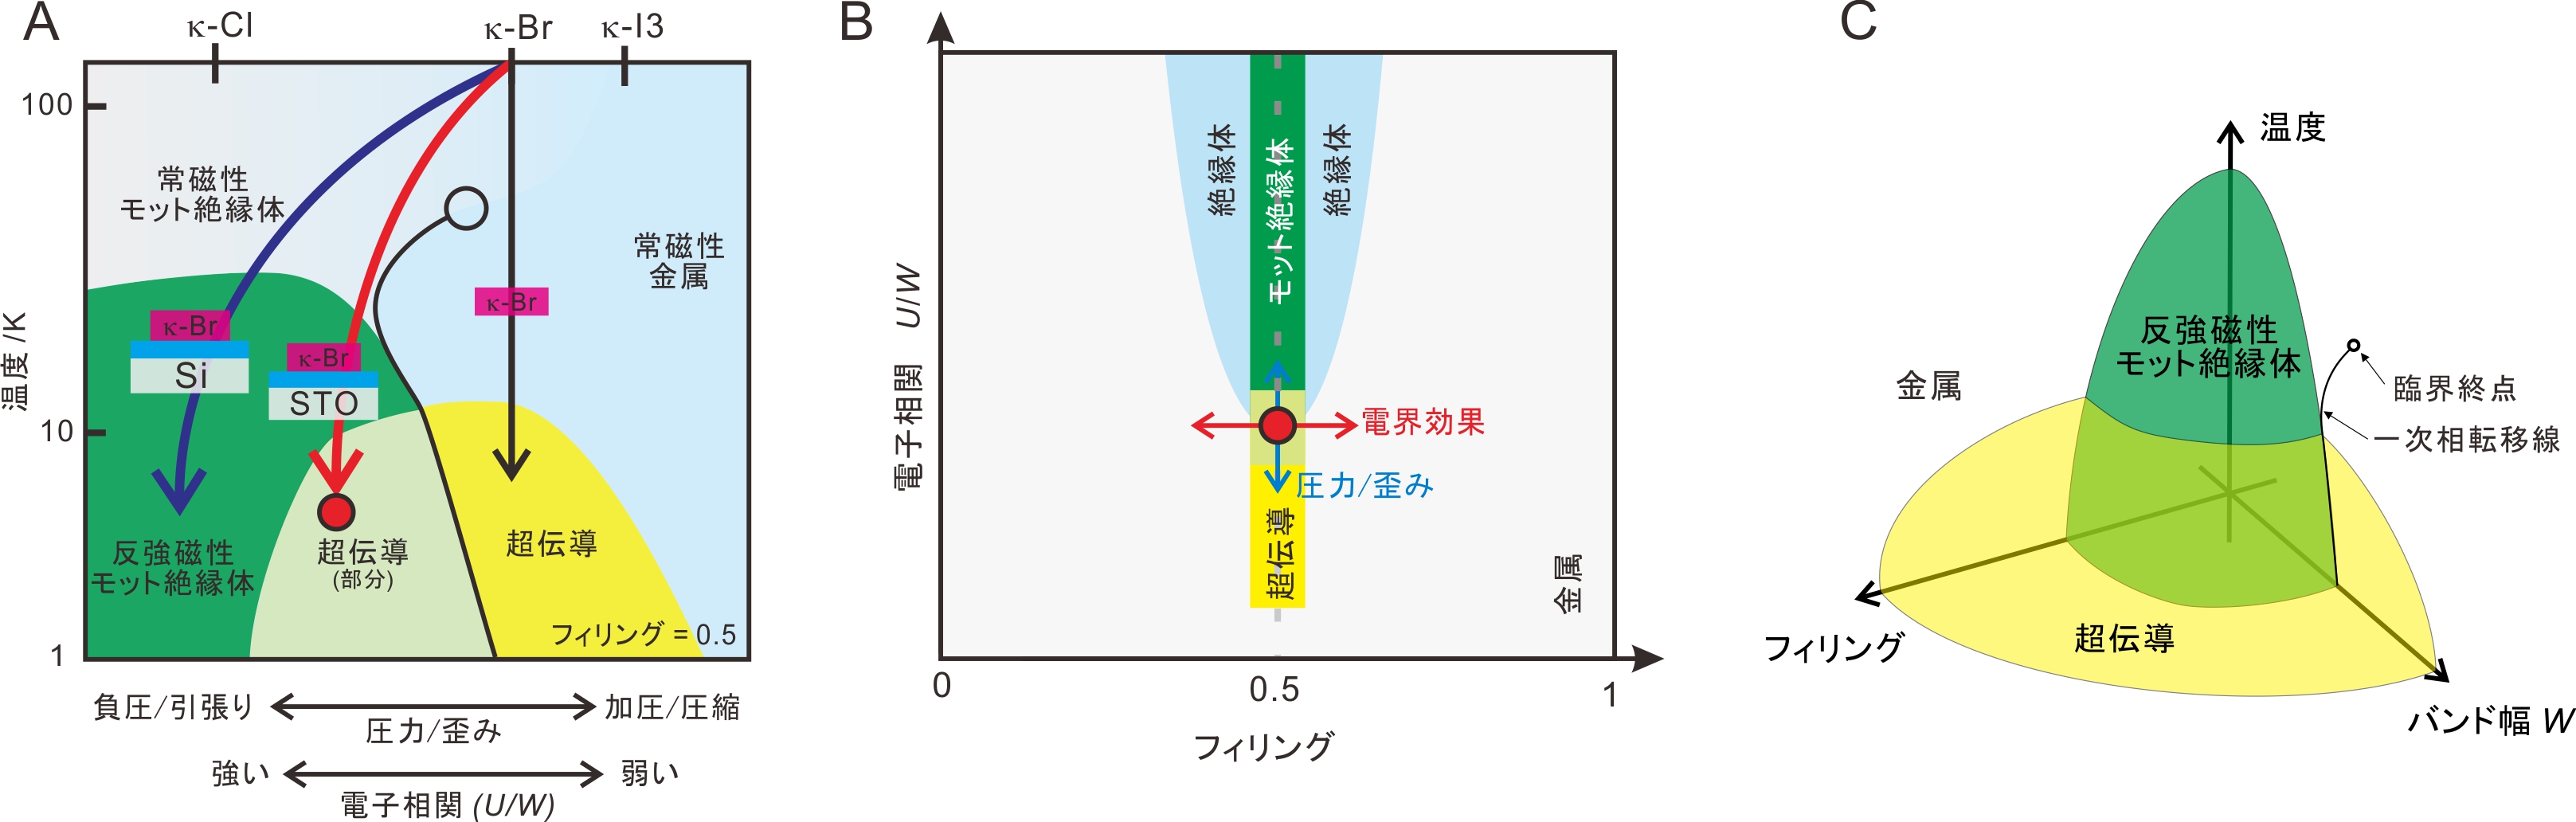
Figure 2 A: Temperature-pressure phase diagram for κ-type BEDT-TTF salt. B: Correlation-filling phase diagram for κ-type BEDT-TTF salt. Based on our measurements, the Mott-insulator seems to be surrounded by superconducting phase. C: 3D phase diagram in the vicinity of 2D Mott-insulator calculated by DMFT (Dynamical mean-field theory).